
Four magnetic parameters, four different meanings
| Parameter | Meaning | Common units | Does not establish |
|---|---|---|---|
| Br | Remanence after saturation, read at H = 0 on the material curve | T, mT, G or kG | The field at an arbitrary point outside a finished magnet |
| HcB | Opposing field where the normal B–H curve reaches B = 0 | kA/m or kOe | The same condition as zero intrinsic polarization |
| HcJ, also Hci | Opposing field where intrinsic polarization J reaches zero | kA/m or kOe | The onset of every acceptable or irreversible application loss |
| BHmax | Maximum magnitude of B × H in the normal second quadrant | kJ/m³ or MGOe | A finished part’s pull force or field at a sensor |
Read material data with the curve and temperature
Br
- Meaning
- Remanence after saturation, read at H = 0 on the material curve
- Common units
- T, mT, G or kG
- Does not establish
- The field at an arbitrary point outside a finished magnet
HcB
- Meaning
- Opposing field where the normal B–H curve reaches B = 0
- Common units
- kA/m or kOe
- Does not establish
- The same condition as zero intrinsic polarization
HcJ, also Hci
- Meaning
- Opposing field where intrinsic polarization J reaches zero
- Common units
- kA/m or kOe
- Does not establish
- The onset of every acceptable or irreversible application loss
BHmax
- Meaning
- Maximum magnitude of B × H in the normal second quadrant
- Common units
- kJ/m³ or MGOe
- Does not establish
- A finished part’s pull force or field at a sensor
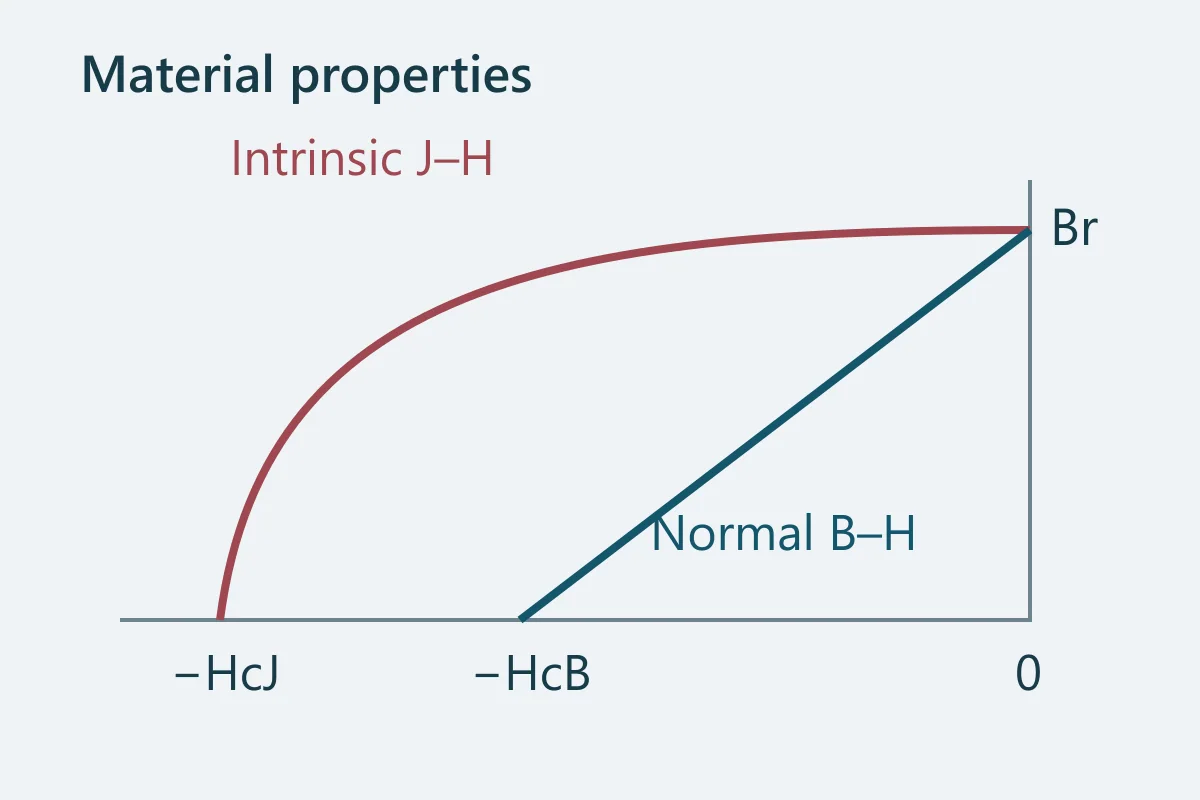
The two coercivities refer to different curves. Intrinsic coercivity is useful when assessing resistance to demagnetization, but the knee shape and operating point also matter. A design can suffer unacceptable losses before the intrinsic curve reaches zero.[1]
Upper curve: intrinsic J–HLower line: normal B–H
BHmax is an energy-density figure: it corresponds to the largest B × H rectangle under the normal demagnetization curve. Two pieces of the same material can share BHmax while having different volumes, fields and useful magnetic circuits.[3]
Separate material data from part measurements
A material table characterizes the magnetic alloy under defined measurement conditions. A finished magnet also has a shape, volume, magnetic axis and operating point. Its surface field is spatially variable; its total magnetic moment is a different measurement again.
Pull force belongs to a mechanical separation setup with a target, gap and direction. It cannot be read from the Br column. Similarly, a quick gaussmeter reading does not by itself establish all the material properties or prove that a part meets a particular grade.
TDK distinguishes basic material characterization from product-level measurements and describes the need to agree fixtures and procedures. A useful acceptance specification should make the same distinction.[5]
Physical properties need their own fields
Density supports mass estimates. Thermal expansion affects fits and may depend on the direction relative to the magnetic axis. Mechanical properties describe a hard, brittle material, so they should not be used to treat the magnet as a structural fastener. Surface treatment and assembly can introduce additional limits.
Published physical data are often typical values. Keep those separate from a guaranteed minimum magnetic property or a finished-part tolerance. For weight calculations, use the actual material route: a bonded compound is not assigned the density of a fully dense sintered alloy.[4]
The density and weight guide, inspection checklist and sintered/bonded comparison address these decisions separately.
Compare sheets without mixing their assumptions
- Match material family, forming route, manufacturer code and revision.
- Read the column units and whether each value is minimum, maximum, typical or a range.
- Match the reference temperature and obtain curves for the intended operating temperatures.
- Check geometry or processing conditions attached to the data.
- Specify which finished-part measurement will establish your functional requirement.
For flux density, 1 T = 1,000 mT = 10,000 G. A decimal error between tesla and kilogauss can radically change the apparent material comparison. Do not compare raw numbers from different unit columns.
Arnold’s NdFeB data separates typical and minimum quantities and stresses the effects of size, shape and alignment. Keep those qualifiers with any values transferred into a drawing or inquiry.[2]
Technical sources
Source material has its own scope and conditions. These references explain technical choices; they are not evidence of our stock, certifications or supplied products.
- Arnold Magnetic Technologies: Magnetic properties and measuring techniques
- Arnold Magnetic Technologies: NdFeB material properties and grade data
- Dura Magnetics: Maximum energy product and grade
- K&J Magnetics: Neodymium material specifications
- TDK: NEOREC product guide: materials, measurement and precautions